Pluvial
Automated Water-Reuse Prospecting Engine
The Data Pipeline
129 million records.
11,577 opportunities.
The entire continental US building stock — ingested, filtered, joined across six independent data authorities, and scored in a single automated pipeline.
Building footprints ingested
Microsoft USBuildingFootprints + Overture Maps — entire continental US
Commercial candidates
Filtered by NAICS codes, roof area >100,000 sq ft, non-residential classification
Fully scored buildings
After joining precipitation, utility rates, ESG risk, and regulatory layers
High-opportunity targets
Top-ranked across 37 states — surfaced on the interactive map
Six Data Authorities
Geometry
Microsoft USBuildingFootprints
129M records — polygon area, classification, centroid
Industrial signals
EPA Facility Registry Service + NAICS
Flags cooling towers: non-potable water demand proxy
Climate yield
NOAA 30-Year Climatology Normals
Location-specific rainfall to calculate max harvestable gallons/yr
Financials
EFC Utility Dashboards + Municipal Open Data
Localized water/sewer rates for NPV, payback, ROI
ESG & risk
WRI Aqueduct Water Risk Atlas + SBTN/GRI
Drought stress index + corporate water-target compliance scores
Policy
TCEQ + State Tax Codes
Equipment exemptions factored into base and upside financial scenarios
The Score
Five dimensions.
One score.
Every building in the dataset is ranked by a composite score that merges physical, financial, policy, ESG, and climate signals — no single dimension dominates.
The output: a ranked list of the highest-certainty, highest-return targets across the country, each paired with a three-scenario financial model and an AI-generated investment brief powered by Gemini.
Physical Viability
Roof polygon area, geometry classification, structural signals from satellite + footprint data.
Financial Return
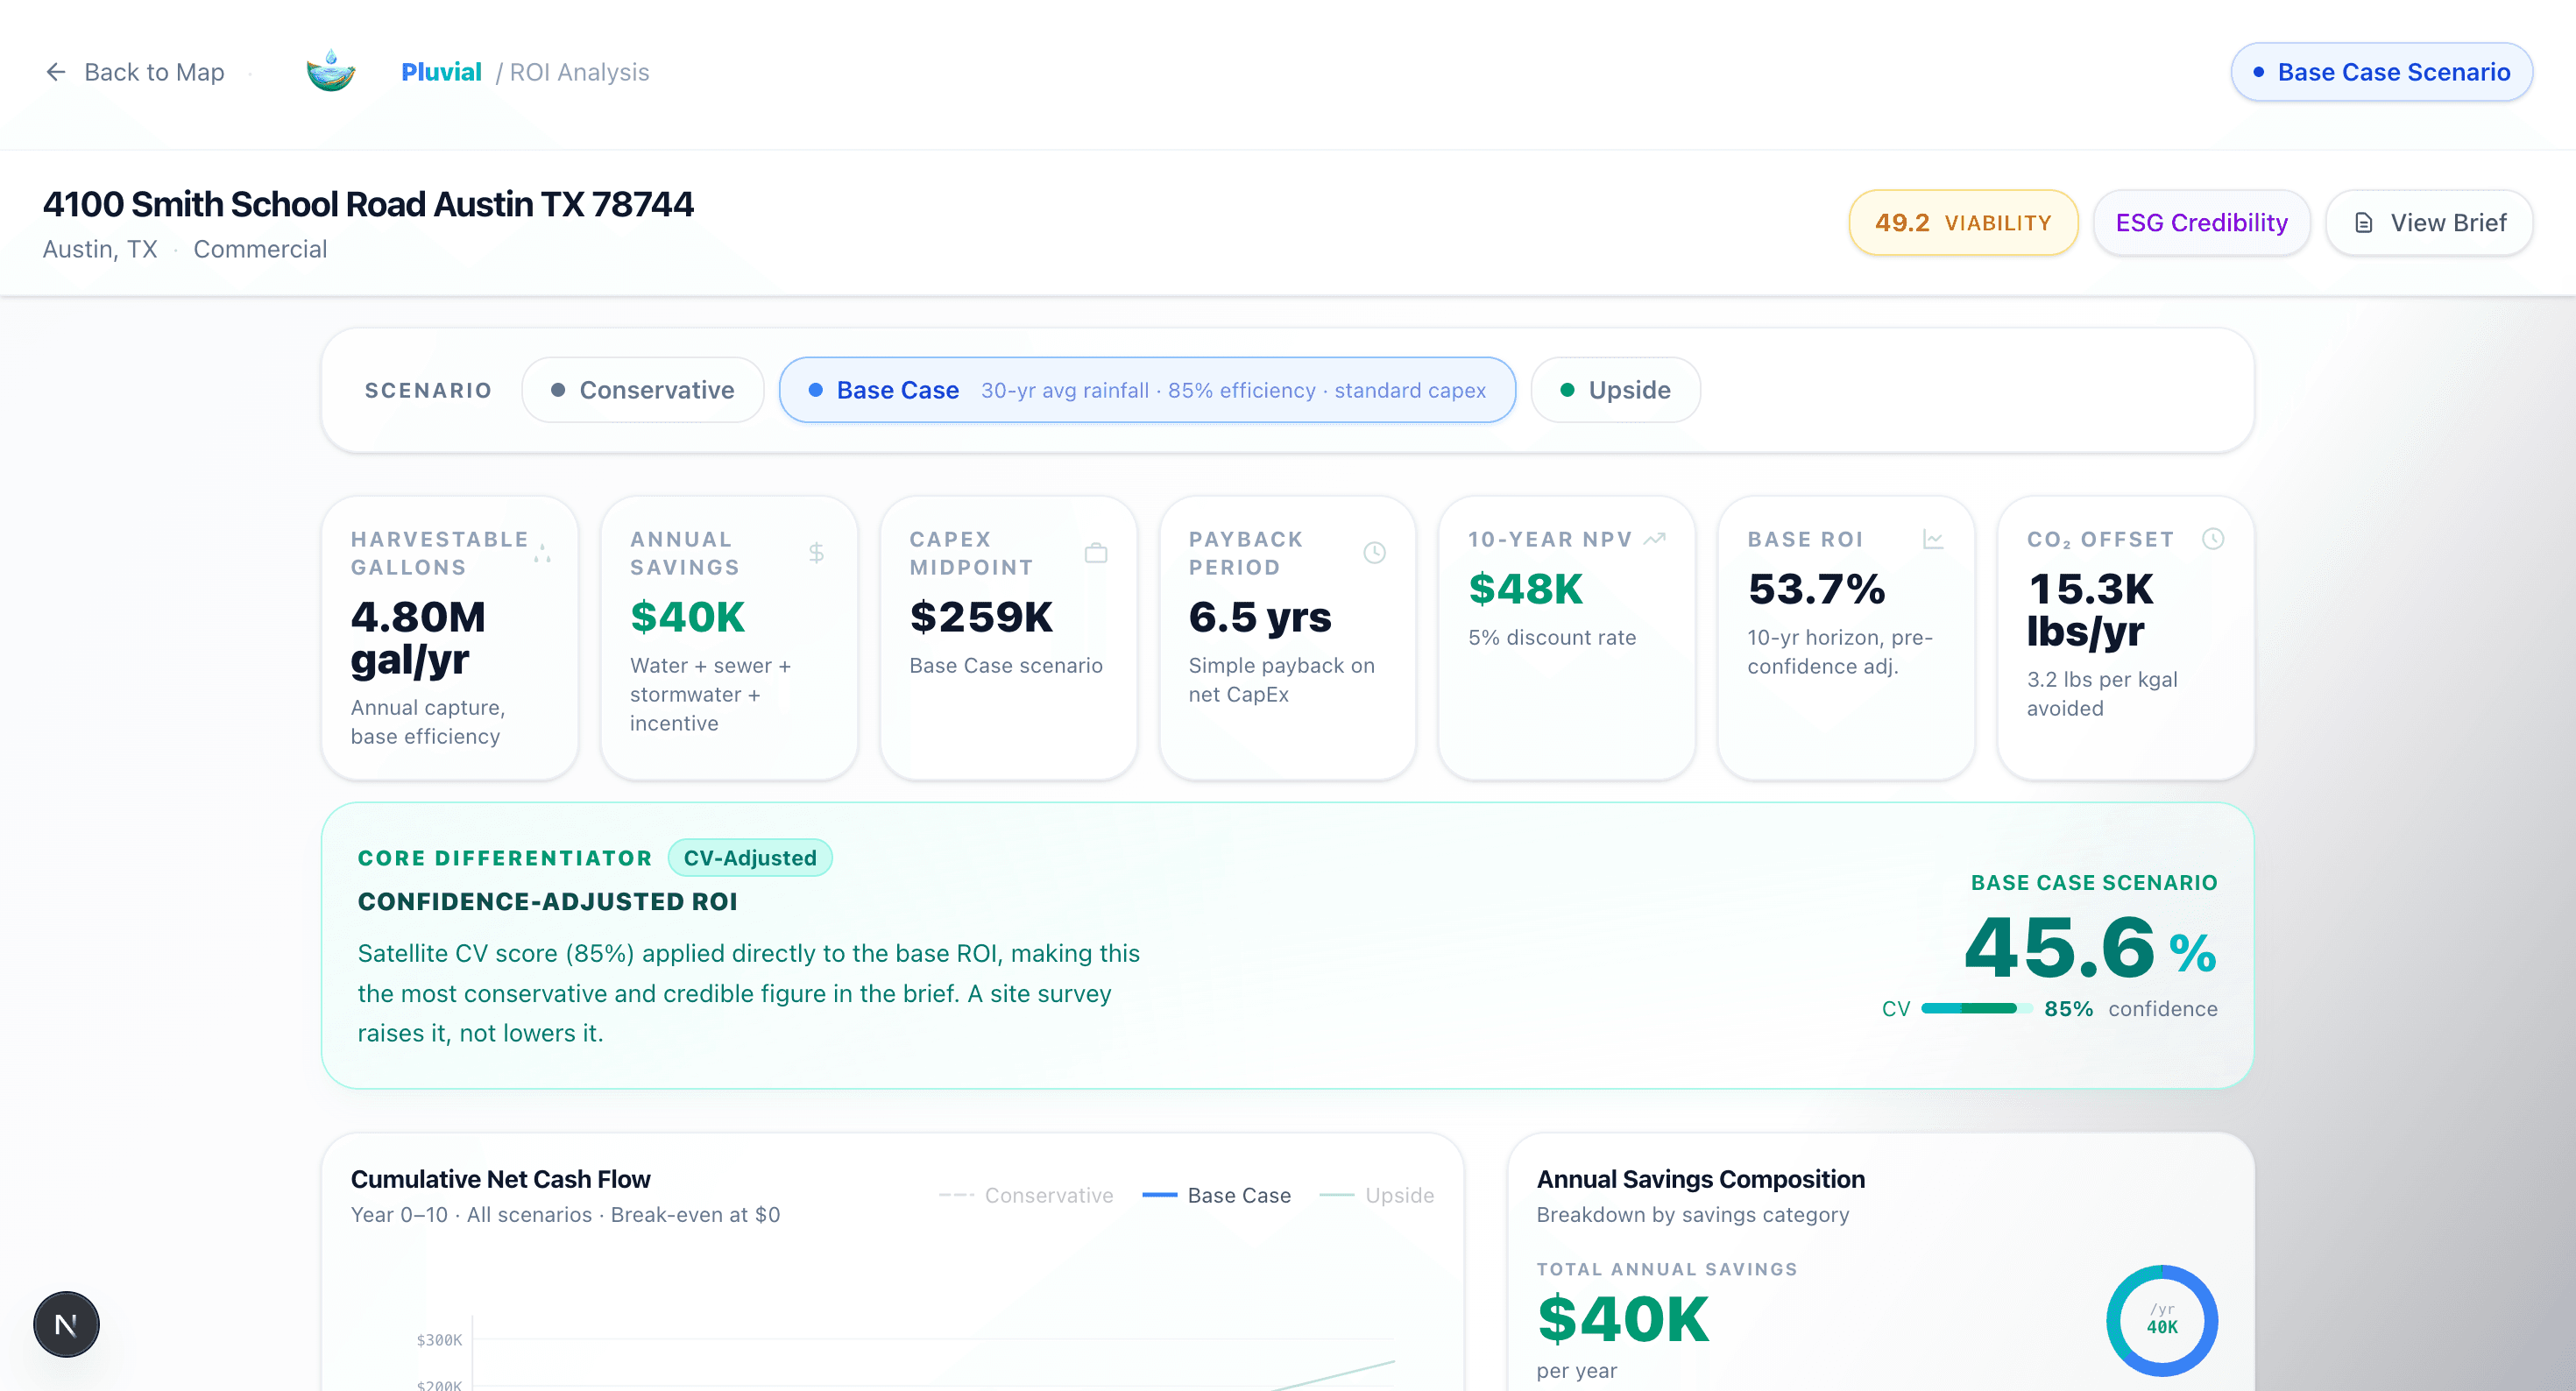
Three-scenario ROI model: base, conservative, upside. 10-year NPV, payback period, annualized savings.
Regulatory Incentives
State-level equipment tax exemptions, rebate programs, stormwater fee offset calculations.
ESG Alignment
SBTi water target compliance, GRI water reporting relevance, corporate sustainability mandate fit.
Climate Drought Risk
WRI Aqueduct water stress score + SBTN basin criticality — urgency multiplier on ROI.
Recognition
Placed at HackSMU VII.
3rd Place Overall
Southern Methodist University · Dallas, TX
Prize Awarded
Apple AirPods